Paul Williamson, KB5MU
Here’s a summary of Dialogus debugging progress leading up to September 2, 2025 and resulting in improved code committed to Git at https://github.com/OpenResearchInstitute/dialogus/commit/741137a17cadbf68086392bce4805cf1d037a029 . The problems we were attempting to address, and some of the key observations made along the way, are captured in this Git issue: https://github.com/OpenResearchInstitute/dialogus/issues/22
Recall that the problems we were seeing had to do with the flow of encapsulated Opulent Voice frame data to be transmitted from the user interface program Interlocutor to the transmit output of the Pluto, where we can observe it with the Rigol RSA5065N spectrum analyzer in the Remote Lab. Let’s start with a rundown of the components of that flow, as implemented here in the lab.
Components of the Frame Data Flow for Transmit
Interlocutor (https://github.com/openresearchinstitute/interlocutor) is a Python program running on a Raspberry Pi 5. It accepts voice input from an attached microphone and/or text message input from a keyboard. Interlocutor understands the logical structure of an over-the-air Opulent Voice frame. It composes these frames to contain the data to be transmitted. Each frame contains 12 bytes of Opulent Voice frame header and 122 bytes of COBS-encoded payload data, for a total of 134 bytes.
Interlocutor encapsulates each packet into a UDP message with port number 57372 addressed to the IP address of the Pluto. The Linux networking stack routes this by IP address to the appropriate network interface port, eth1 in this case.
But eth1 is not physically an Ethernet port at all. The Pluto doesn’t have an Ethernet port. It does have a USB port, and one of the standard ways to connect a Pluto to a computer is to use Ethernet over USB. There are several such protocols, any of which can make the USB connection act like a network connection. The supported protocols on the Pluto are RNDIS, CDC-NCM, and CDC-ECM. Linux supports all three of these protocols, but Windows and macOS each support only one, and of course it’s not the same one. Because we are using more Macs than Windows computers here, we chose CDC-NCM, which is the one supported by macOS. This is configured in the Pluto as explained in https://wiki.analog.com/university/tools/pluto/users/customizing
So our encapsulated packets flow over this simulated Ethernet and arrive in the Pluto. Recall that the Pluto is based on a Xilinx device that contains an ARM computer core and an FPGA fabric (Zynq XD7Z010-1CLG225C), plus an Analog Devices AD9363 radio transceiver. The ARM core runs a build of Linux provided by Analog Devices at https://github.com/analogdevicesinc/plutosdr-fw , which we have lightly customized at https://github.com/openresearchinstitute/pluto_msk/firmware . The encapsulated packets arrive over the USB port (which is part of the Zynq) and are handled by the Linux network stack running on the ARM.
Dialogus (https://github.com/openresearchinstitute/dialogus) is a C program running under Linux on the Pluto’s ARM. Built with the command line flag -DOVP_FRAME_MODE, it listens for the encapsulated Opulent Voice frames arriving on UDP port 57372. Its job is to arrange for the frames to be transmitted in the specified way using the MSK modulator.
The MSK modulator is a part of Locutus (https://github.com/openresearchinstitute/pluto_msk), the FPGA-based implementation of an Opulent Voice modem. Overall, Locutus is a modification of the standard reference design for the Pluto FPGA, provided by Analog Devices within https://github.com/analogdevicesinc/hdl . The reference design is what ships installed with the Pluto to create the PlutoSDR product. PlutoSDR is what’s usually described as a Software Defined Radio (SDR) device. That is, it is a translator between I/Q samples and RF signals, capable of any type of radio transmission and/or reception within its limits of frequency coverage, bandwidth, and sample rate, but only in conjunction with a computer that can supply and/or interpret the stream of I/Q samples. The device itself doesn’t know anything about any modulation or waveform details. That’s up to the connected computer.
Since the goal was to implement the modem inside the FPGA, we add modem blocks inside the mostly-unchanged FPGA reference design. Instead of exchanging I/Q samples with the computer, it exchanges data bits.
Inside the reference design, data flow between blocks is mostly done using a scheme called AXI-S (Advanced eXtensible Interface – Stream). This involves multiple handshaking signals between any two communicating blocks, arranged such that a small quantum of data is transferred when both sides are ready for the transfer, no sooner and no later. Each block has to be designed so that it can pause its operation seamlessly and await the readiness of the other block. This scheme allows for various blocks within the design to process at different speeds, even varying their processing rate in time, without any block falling behind.
Specifically, in the transmit pipeline, the first major block that handles incoming data from the computer is a specialized DMA controller, with access to the ARM’s memory on the computer side and an AXI-S interface on the other side. In the reference design, this DMA controller feeds into a series of scaling and filtering facilities, which in turn feed into the final processing stages before the DACs. We replaced the unneeded scaling and filtering blocks with the MSK modulator block. Data bits come in from the computer’s memory through the DMA controller and are delivered to the input of the Modulator block. The Modulator block outputs I/Q samples, which pass on into the rest of the reference design’s pipeline, eventually to be delivered to the DACs to create the analog signals.
The framework that controls how a computer talks to and controls PlutoSDR is called IIO, for Industrial Input/Output. It’s an extensive system meant to be general purpose for all sorts of devices that stream data to and/or from a computer, fast or slow. Besides the sample streams themselves, IIO provides a variety of control and status functions. With these, the computer can control the radio as well as the flow of samples. The computer side of IIO can be run on a local machine such as the ARM inside the Pluto, or over a USB interface, or over a network interface. So, PlutoSDR with IIO is __almost__ exactly what we needed. We use IIO essentially as in the reference design, except that we abuse the IIO interface with the computer by using it to carry data bits instead of I/Q samples.
One other thing that will turn out to be important about IIO: because it’s designed to work with both fast hardware and relatively slow software, it handles samples in relatively large batches. The user software creating transmit samples fills up a buffer full of samples using IIO utility functions, and then “pushes” that buffer into the Linux kernel where the actual transfer takes place. The kernel manages a finite pool of buffers, four by default, though this can be adjusted. If a kernel buffer is available, the push operation is quick. If the kernel buffers are all in use, presumably three are full and waiting their turn and one is actively being transferred to the hardware. In that case, an attempt to push a new buffer will result in the user program blocking until a kernel buffer is freed. This creates a similar effect to the AXI-S handshaking: the user program is slowed down so it never gets too far ahead of the hardware processing.
The 8X Problem
The problem initially detailed in Issue #22 referenced above was that the transmission observed on the spectrum analyzer was taking approximately eight times as long as it should have been taking. The shortest transmission is a single 40ms frame, but we also send a 40ms frame of preamble before the data frame, and follow it with 25 dummy frames (one second) of “hang time” in case another transmission comes along right away, and follow that with a 40ms frame of postamble. So that short transmission occupies 28 frames, which is 1120ms at 40ms per frame. The duration actually observed was estimated at 8500ms using a stopwatch. Here’s what it looked like on the waterfall on the spectrum analyzer:
Image: Short transmission extended by 8x
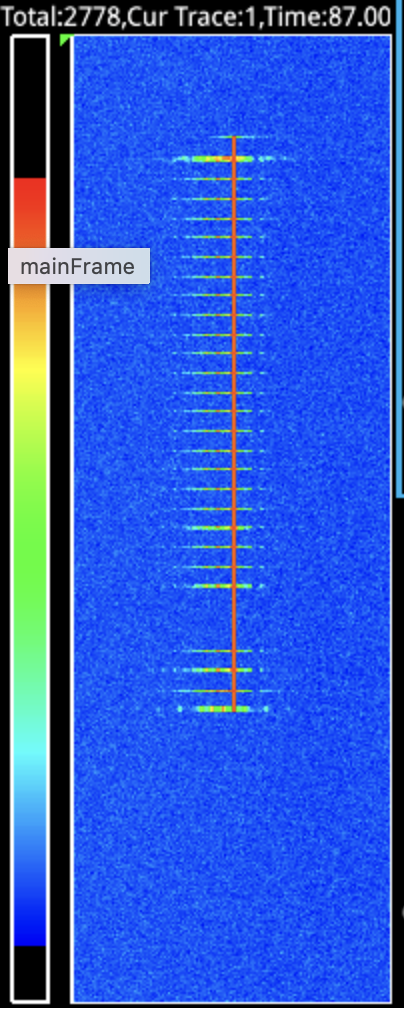
The Zynq contains a hardware clock that’s useful for precise timestamping from software. I made use of this facility to timestamp each frame, and found most of them to be spaced 302ms to 303ms apart, instead of the nominal 40ms. The spacing was suspiciously consistent. What’s more, the first few frames were transferred more quickly. This was consistent with the spectrum analyzer waterfall display shown in the original issue #22 comment.
After some confusion and fiddling around, the cause became evident. The IIO buffer size in use had not been adjusted to match the size of the transfer. It was set to 1024 samples. Since the Opulent Voice system is intended to be used with realtime voice conversations, we don’t buffer up multiple frames. Instead, there’s an IIO transfer for each individual frame. Since we are sending the logical data from the UDP-encapsulated frame, that is only 134 bytes. 1024 / 134 = 7.6, and 7.6 * 1120ms is 8559ms, neatly accounting for the observed duration. The software was packing 134 bytes into each buffer, and then pushing the whole 1024-byte buffer into the kernel, and the Pluto had no way to know that only the first 134 bytes were significant.
There are two ways to solve that. The simplest way is to change the buffer size to match the frame size, 134. With no other changes, that eliminated almost all of the excess delay. The other way is to leave the buffers alone, and instead replace the calls to iio_buffer_push() with calls to iio_buffer_push_partial() and pass a length of 134 to the latter function. We were suspicious of iio_buffer_push_partial(), because we remembered having difficulty with it in a previous encounter, so I tried both methods and compared the results. Both apparently worked the same. I decided to stick with changing the buffer size to 134.
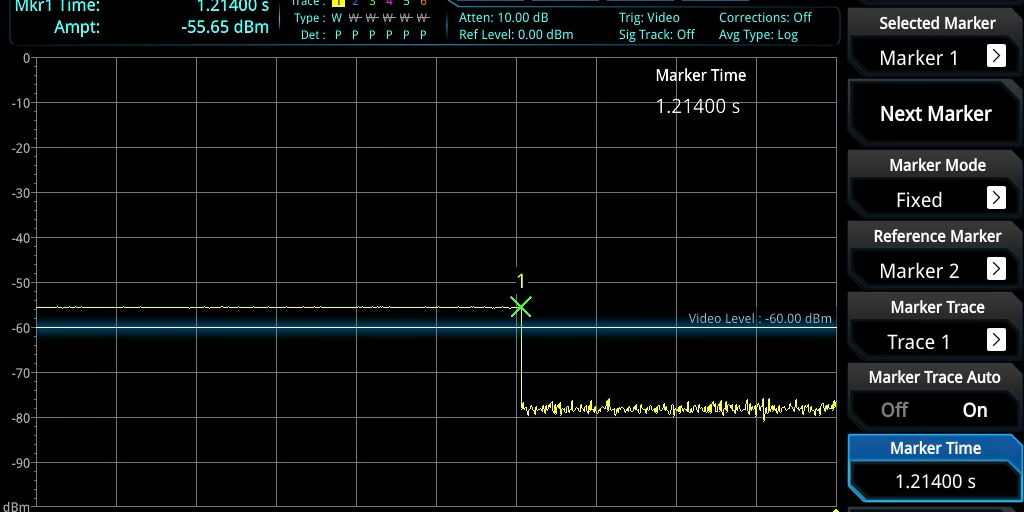
Looking again at the waterfall display on the spectrum analyzer, we could see that the duration was very close to correct, even though there’s no way to get a precise time measurement from the waterfall display. But now we had precise timestamps in the code, and we could see from the timestamps that the duration was still a little bit long, 1214ms instead of 1120ms. That was an extra 94ms unaccounted for. I re-learned how to use the spectrum analyzer in zero-span mode, and was able to see that the 1214ms duration was real, and not an error in how the timestamps were handled. Like so:
Image: 4ms transmission seen in zero-span mode
Putting the spectrum analyzer back into waterfall mode, we observed that the signal was not entirely clean during that 1214ms period. There appeared to be small gaps in the modulation. Something was still wrong.
Possibly Leaking Kernel Buffers
The timestamp trace (posted in a comment to Issue #22) showed that each call to iio_buffer_push() was taking about 39ms to return. That was nice and consistent, but it should not have been. With four kernel buffers allocated, at least the first three calls to iio_buffer_push() ought to return very quickly. But we weren’t seeing that, even after long idle periods.
A reboot of the Pluto cleared up this issue. We found that all 28 of the iio_buffer_push() calls in a short transmission were returning in under 2ms, as expected. The overall duration of the transmission had fallen to 1135ms, just 15ms longer than nominal.
This was still a little too long to attribute to measurement uncertainty. We concluded that there were probably brief underruns adding delays between frames, and attributed this to a timeline with no slack for timing uncertainty introduced by the USB Ethernet interface. We resolved to get control over the timeline and redesign it with wider windows, but in the meantime we moved on to longer transmissions. Voice transmissions.
Voice Transmissions Still Getting Stretched
We made voice transmissions for a count of 10 or 20 mississippis using the PTT button in the Interlocutor GUI. During the transmission, we observed the waterfall display on the spectrum analyzer. There appeared to be tiny gaps, medium sized gaps, and a few pretty large gaps in the modulation (never in the overall power). That’s not right.
We were also collecting timestamp information, of course. It showed that there were 469 encapsulated frames processed, which would add up to 18.76 seconds at 40ms each. At this point, we happened to be using iio_buffer_push_partial(), and the debug log showed 645 calls to iio_buffer_push_partial(). The 645 – 469 = 176 extra pushes could only have been frames inserted by the Dialogus code. It always inserts a preamble frame and a postamble frame, and the log showed that it inserted 174 dummy frames, so that adds up. Only the 25 dummy frames at the end of the transmission are expected, leaving 149 dummy frames that must have been inserted due to underruns. That is, when a 40ms boundary passes and no new encapsulated frame data is available, Dialogus sees this as a possible end of the transmission and starts to count off a one-second hang time filled with dummy frames. This event was also visible in the log, 61 times. That works out to about 2.5 dummy frames emitted per declared hang time. That’s too much to be due to narrow timing windows; each failure to hit a window by a millisecond or several would only generate a single dummy frame. There were still excess dummy frames being sent.
I made a table of the function call durations for iio_buffer_push_partial(), which we were still using at that time. It tells a confusing story. A total of 18 calls were 7ms or less, indicating that the kernel buffer was freed around the same time the next buffer was pushed. A total of 501 calls were clustered around 40ms, indicating that all the kernel buffers were full around the time the next buffer was pushed. The remaining 126 calls had durations ranging all the way up to 1000ms, which caused an IIO timeout error. How is that possible, with only four kernel buffers that only take 40ms each to clear out? Seemingly at least one of these assumptions is wrong.
A Period of Confusion
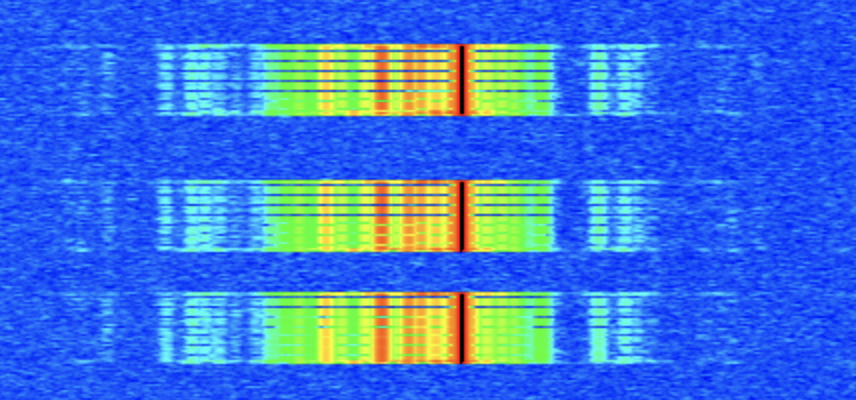
We went back to trying to characterize the behavior during short transmissions, mainly because they seemed a lot closer to being correct and they were easier to experiment with. I captured a test with three short transmissions on the waterfall, with matching log files. The three transmissions contained exactly the same data, but they did not look alike on the waterfall. The visible gaps looked different:
We mused about the limitations of the waterfall display. It works by capturing some number of samples, doing an FFT on them, and drawing a row of pixels on the display, and that happens approximately 30 times per second. I don’t recall seeing any documentation on how many samples are used, but it’s probably much less than 100% duty cycle. Worse, 30 per second is barely faster than our frame rate of 25 per second, so we are unlikely to clearly see any details at the level of individual frames, much less fractions of a frame. A faster waterfall display would be useful to have.
For these three short transmissions, I measured the time between successive calls to iio_buffer_push(). Except for several well-understood special cases, they were all clustered tightly around 40ms, as expected.
Image: Three short transmissions on the waterfall
I also measured the duration of each iio_buffer_push() call. They were all 1ms or shorter. That’s good.
And the overall transmission session durations were 1132ms, 1134ms, and 1133ms, still a tiny bit long. Maybe that could be explained as overhead?
The only worrisome indication of a problem was the appearance of the waterfall, and we’re not sure how meaningful that really is for these short transmissions. But we hadn’t forgotten the voice tranmissions, which were clearly terrible on the waterfall.
USB Ethernet Suspected
I had spent a lot of energy trying to blame the USB Ethernet connection between the Raspberry Pi and the Pluto. Probably because it was an external interface that I didn’t fully understand and could not trace. I went so far as to shop for USB sniffer devices so we could see what was actually happening on the bus. They are expensive, and none of the devices I found advertised a feature for tracing USB Ethernet.
To try and answer this question, I made a special Dialogus build that didn’t process any of the encapsulated frames beyond noting their length and some bytes of data from each one. This removed any interaction with the FPGA from the test scenario. I ran a lengthy transmission through it. Every single encapsulated frames arrived like clockwork, within several milliseconds of 40ms. The USB Ethernet was working fine when isolated from IIO.
Doing the Arithmetic
During Open Research Institute’s regular Tuesday morning Zoom call for FPGA development projects and such, we had a chance to discuss this with the designer of Locutus, Matthew Wishek, NB0X (see https://www.openresearch.institute/2025/08/04/matthew-wishek-wins-2025-arrl-technical-innovation-award/ ). I had made an attempt to read the relevant VHDL code in the pluto_msk repository to clarify my understanding of how the Modulator interacted with the surrounding AXI-S interfaces. Matthew confirmed my shaky understanding that the Modulator would consume data bits at an absolutely constant rate, and that it was not capable of slowing down for an underrun or of exerting extra “backpressure” on a data source that was trying to go too fast. That constant rate was familiar to me from working on the numerology for the older 4FSK version of Opulent Voice: 54200 bits per second.
A bit of light began to dawn.
That number is based on a full implementation of the Opulent Voice waveform. It starts from our choice of one of the recommended bit rates for the Opus audio codec, which is the key to excellent voice quality. We long ago decided to allow the voice codec to use 16000 bits per second. We also chose one of the frame durations recommended by Opus, 40ms. 16000 * 0.040 = 640 bits = 80 bytes. Wrap it up in IP/UDP/RTP as is usually done for streaming Opus on networks, and you’re up to 80 + 12 + 8 + 20 = 120 bytes. Add 2 for packet framing using COBS, 122. Add 12 bytes of frame header consisting of 6 bytes of station ID, 3 bytes of authentication tag, and 3 bytes reserved for protocol use, and that’s where the 134 byte 40ms frame comes from.
But that’s not the end of the transmitting process. The header is Golay encoded for FEC, which doubles it size to 24 bytes. The COBS data (including IP/UDP/RTP/Opus) is convolutionally encoded for FEC, which doubles its size as well. Now we’re up to 268 bytes. We also prepend an uncoded frame synchronization word before each frame, so the receiving modem can unambiguously find the frame boundaries. The frame sync is 3 bytes long, so now it’s 271 bytes, 2168 bits, and THAT is what gets fed to the MSK Modulator.
2168 bits * 25 frames/second = 54200 bits per second.
We had been sending the raw data, 134 bytes per frame, to Locutus. That would be great if Locutus implemented the FEC codes and prepended the frame sync word. However, at the current state of development, Locutus is just a bare Modulator. It takes a stream of bits, which have to be at 54200 bits per second, and modulates them using MSK, and that’s all it does. The software doesn’t implement those features, either. We haven’t even reached a firm decision about where those features *should* be implemented, hardware or software. So it was never going to work like that, and we knew that from the start.
I got to work modifying the Dialogus code to send frames of the right length. I added calls in the frame building logic to encode the header and the payload for FEC, and wrote dummy routines that fake the FEC codes by simply including the contents twice. I changed the buffer size to 271, and added checks to make sure the built frames were 271 bytes long. This would at least come close to keeping the Modulator well-fed.
Close But No Cigar
Actually, when tested, it was worse. A lot worse. Nearly every call to iio_buffer_push() was taking a long time. I now understood this to mean that the Modulator was consuming data more slowly than we were trying to send it. Not only were the kernel buffers all full, but they were taking a lot more than 40ms each to empty out.
Nonetheless, I was baffled. I re-examined the code that filled up the buffers, for probably the seventeenth time. This is some of the oldest code in the program, having been taken originally from the Analog Devices example code for streaming samples to a PlutoSDR. It’s full of cryptic calls to IIO utility routines, but I knew what those routines did, and it was nothing very complicated in this case where we had only one I/Q channel open for transmit. Really they were just setting up start index, end index, and stride for a loop that would visit each sample in the buffer. One sample for every channel (total of one channel) would constitute an AXI-S transfer when it got into the FPGA, and that same increment was the unit for allocating buffer sizes. Each sample had room for 16 bits of I and 16 bits of Q. Four bytes. Of course, I knew I had to put one byte of frame data in there instead of I/Q samples, and that’s what the code was doing.
There was one weird thing about the code that I did not know the story behind. The code put that one byte of data in two places within the I/Q sample. It carefully copied the data byte into the high byte of the I and then copied it again into the low byte of the Q. There were lovely comments on each line describing accurately what each line of code was doing at the byte level. Whoever wrote that code must have known the reason for it. Maybe they figured that by filling in the first byte and the last byte, they’d have a good chance of having the byte in the right place. Clearly they were aware that only one data byte needed to go into the sample. Unless they were an LLM.
Funny story. I knew for sure that those lines of code had been changed from the Analog Devices reference code. I remembered that the transmit buffers in that reference code had been filled with all zeroes. Which is just about the stupidest thing you could put into the I/Q samples of a demonstration intended to show how it worked. It would generate no modulation for most normal modulation types, and no power output at all for amplitude-modulation methods. Which we learned the hard way, and wasted some time tracking down.
Anyway, despite several good reasons I should have known better, I assumed that code was probably right and went looking for other things to check.
What About the Register Initializations?
There are a bunch of reads and writes to registers in Locutus as part of the initialization code in the main() function of Dialogus. These were inherited from older programs that did their jobs successfully. Some had been modified as new registers were added, mostly to help with debugging. I undertook to read and check them all against the register definitions. I wasn’t really expecting to find anything.
Until I got to the TX_DATA_WIDTH register. Short description, “Modem Tx Input Data Width”. Long description, “Set the parallel data width of the parallel-to-serial converter”. Default value at reset: 8. I knew what this was. The Modulator block is designed to be flexible about its input format, to make it easier to connect to a variety of hosts. When an AXI-S transfer arrives at the Modulator, this register tells it how many bits of that transfer contain meaningful data bits for modulation. I knew it was 8. It had to be 8, because we needed to send an odd number of bytes in each transfer.
But it wasn’t set to 8 in the initialization code. It was set to 32. That meant the Modulator was trying to send out four bytes for every one byte that we intended. I changed it to 8.
I also wanted to know where in the 32-bit “sample” the 8-bit data was supposed to go. I ran a sequence of tests at TX_DATA_WIDTHs of 8, 16, and 24, checking for modulation with data in each of the four locations within the sample. It turns out the buffer-filling code was wrong in both of the positions where it placed the data byte. It should have been placed in the lower byte of I. This is now corrected and documented in the code.
Characterizing the Results
I made a long voice transmission with all the usual logging. The waterfall looked good, no dropouts visible. The higher tone was much stronger than the lower tone, but that could be just because the data wasn’t scrambled for whitening or really encoded.
I extracted some statistics from the log file and did what felt like a systematic and thorough evaluation. Everything looked good and I got excited and committed the fixed code. I didn’t say so online, but I thought it was fixed. I did promise a detailed report “later on”, and that turned into this document.
On further study (as a result of writing this document) I can see that there are definitely still some things wrong, and clues about where to look next.
The elapsed time between calls to iio_buffer_push() was a mix of around 40ms (2736 occurrences) and around 0ms (662 occurrences). There were no outliers or long waits between push calls. I’m not sure I understand the mix of 40ms and 0ms elapsed times, but I suspect it can be explained by timing jitter around a too-narrow window. Some more debugging may be needed on this one.
I measured the duration of every iio_buffer_push() call. They were all quick. Most values were 0ms, none were longer than 2ms, and only a few examples of 2ms in the run. This is what I’d hope to see.
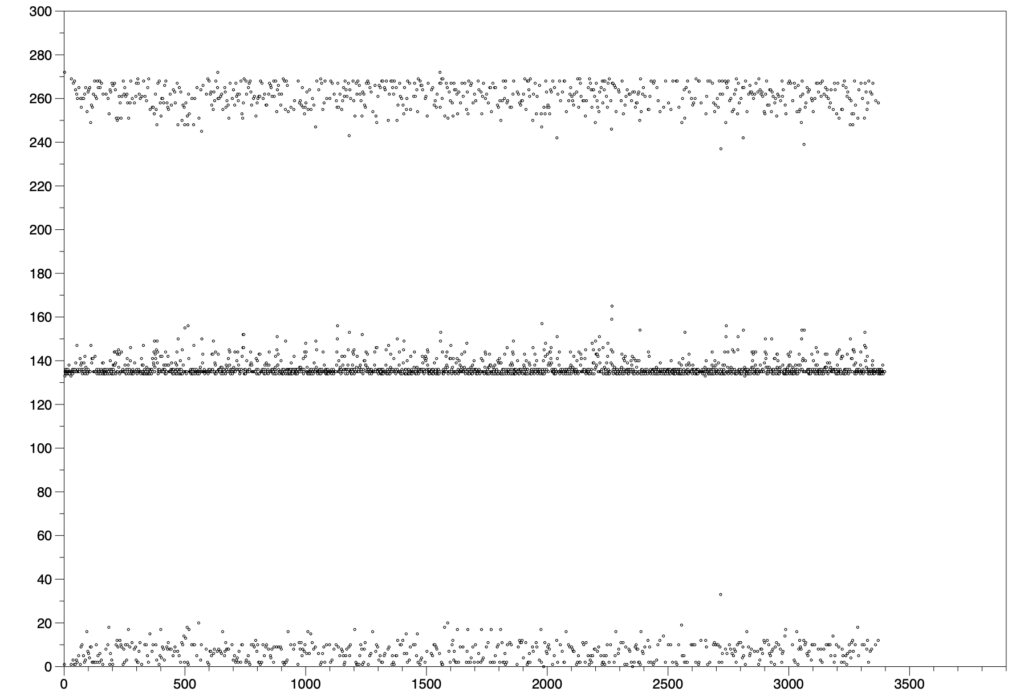
I also looked at the axis_xfer_count register. This is one I haven’t mentioned before. It is supposed to measure how many AXI-S transfers have taken place. I logged it as a cumulative value and also as a differential between pushes. The difference between start of session and end of session was 458597 transfers, which is almost exactly 135 (not 134) transfers per push, but 169.4 transfers per frame as measured by the overall duration of the session, which was 2707 x 40ms. Neither of those numbers makes sense. It ought to be 271 per frame now. The distribution of the delta values was interesting, too:
I logged starts and cancels of hang times. There were 664 hang times declared and canceled. I didn’t log dummy frames, but I captured periodic statistics reports and they reveal that 689 dummy frames were sent. Discarding the 25 dummy frames at the natural end of transmission, that’s 664 dummy frames, exactly one for each hang time declared. That’s what we would expect from short underruns. Looking for patterns in the hang time events, I see cases where an encapsulated frame is logged as arriving after a hang time is declared, but the hang time is not canceled. This suggests race conditions in the hang time checking.
Image: Delta of axis_xfer_count between buffer pushes
Conclusion
The debugging detailed here was (probably) good progress, but there’s more work to do before we can consider the problems solved.
The final test will of course be to receive the transmissions created this way, and check that the data error rate is appropriate at a variety of signal strengths. Getting the receiver to work that well may be the harder part of the problem, so it’s essential to keep looking at Dialogus until every weird behavior is understood or corrected.